WHO Coronavirus (COVID-19) Dashboard
- Anang Hendro
- Dec 21, 2022
- 1 min read

Updated: Jan 24, 2023
Tools : Tableau Public, Figma, Google Sheets
This project served as a practice for conducting Exploratory Data Analysis (EDA) using Tableau and displaying the results in dashboards
Background Information
COVID-19, also known as the coronavirus disease, is a respiratory illness caused by the SARS-CoV-2 virus. The pandemic began in late 2019 and has since spread to affect every country in the world. Over the past two years, the virus has had a significant impact on global health, economies, and daily life, as governments and health agencies have implemented measures such as lockdowns, travel restrictions, and mask mandates to try to slow the spread of the virus. The number of confirmed cases and deaths from COVID-19 has varied widely around the world, with some countries experiencing more severe outbreaks than others.
In the context of COVID-19, data analytics may be used to visualize the spread of the virus over time, identify trends and patterns in the data, and compare the performance of different countries or regions in the form of a dashboard.
Objective
There are several common goals that many COVID-19 dashboards aim to achieve:
Providing up-to-date information about the pandemic, including the number of confirmed cases, deaths, and vaccinations.
Identifying trends and patterns, which can help policymakers and public health officials to better understand the spread of the virus and make informed decisions about how to respond.
Monitoring the effectiveness of public health measures, such as lockdowns, mask mandates, and vaccination campaigns.
Supporting decision-making for policymakers and public health officials about how to respond to the crisis.
Enhancing transparency and accountability by providing a clear and accessible source of information about the pandemic
Insights
Data for the dashboard was collected from WHO website and Worldmeter. After the dashboard was created, a number of discoveries and insights were found.
The highest peak of daily and weekly cases occurred during the beginning of 2022 with the highest daily cases reaching 2.1 M and 11.7M for weekly cases. However, the number of cases kept decreasing towards the end of the year

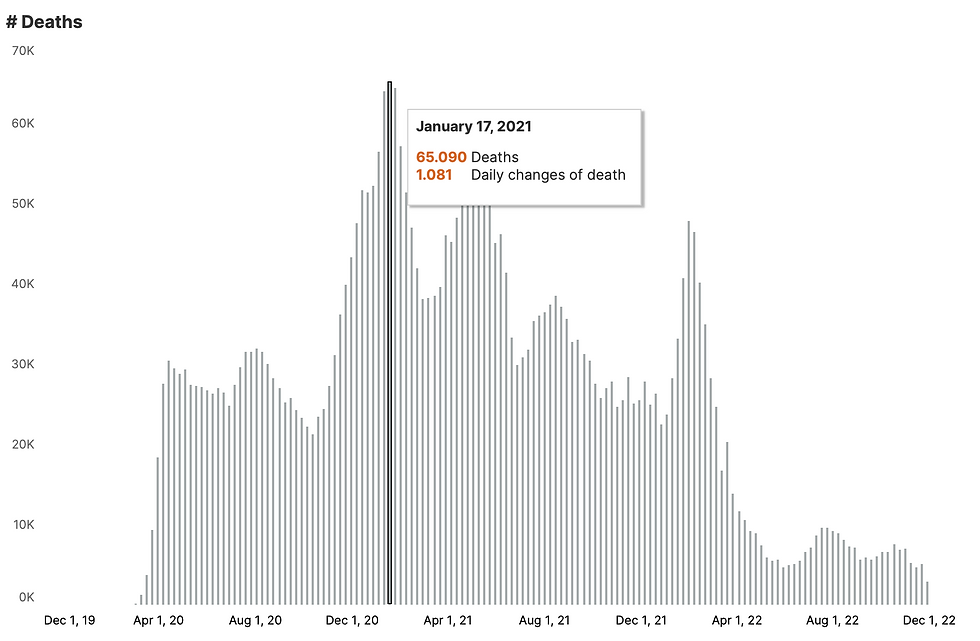
The highest peak of new deaths occurred during the beginning of 2021 from January fluctuating until May, with the highest number of deaths reaching 10K daily and 65K weekly deaths. The same trends arose again during the beginning of January 2022 but slowly decrease towards the end of the year
From 236 countries in the dataset, some countries still exhibit a high number of new cases and deaths. These countries are the United States of America, Germany, Brazil, Italy, United Kingdom, Russia, Mexico, Indonesia and Peru. Most of the listed countries currently rank as the most populated countries (ie United States of America, Indonesia, Brazil, Mexico, Germany and United Kingdom). Most likely because the high population in these countries required more time and strategy to decrease the number of cases and deaths


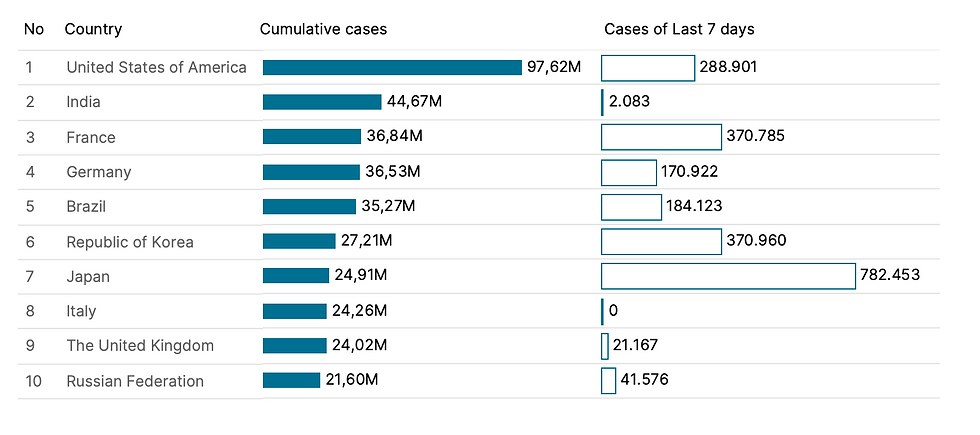
Despite the United States of America being the country with the highest cumulative cases of COVID-19, for the last 7 days Japan exhibits a high number of confirmed cases (782k) followed by South Korea and France (around 370k)
Based on the region, Europe currently has the highest cumulative case of COVID-19. However, if we look at the case for the last 7 days, Western Pacific actually contributes the highest number of new cases
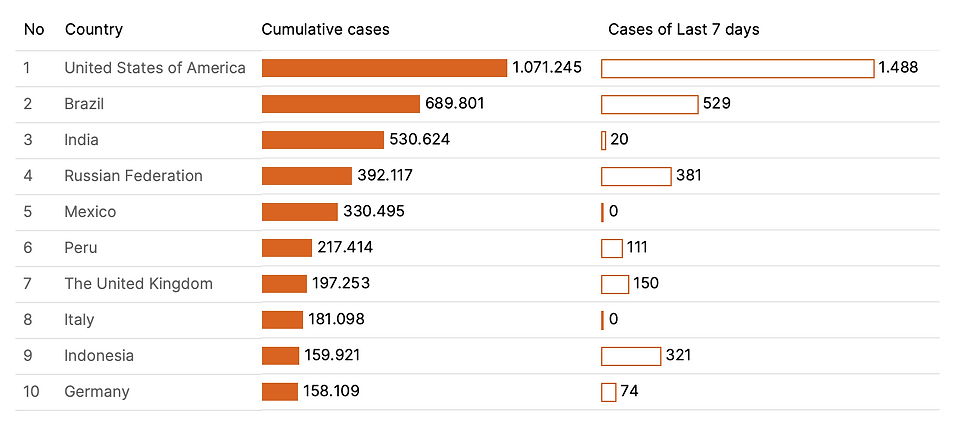
United States of America exhibits the highest number of cumulative and new deaths in the last 7 days among all the countries. Not only that but Americas region still hold the highest rank for the region with the highest number of cumulative new deaths in the last 7 days
70,67% of the world's population already got at least one dose of vaccines which aligns with WHO goals. However, only 64.82% of the total population is fully vaccinated and only 30,12% got the booster shot
Only 3 regions (Western Pacific, America and South-East Asia) met the vaccinations goal of 70% (at least one dose) with Africa being the region with the lowest penetration of vaccines with 31.25%

If we look at the Country breakdown, we can also see that most African countries still have low penetration of vaccinations (under 50%)

Recommendations
For countries with a high number of cases, policymakers and public health officials could implement various regulations and policies (such as work-from-home policy or limiting high-scale events such as concerts) to decrease the overall number of cases and death
The government of the United States of America could increase the number and frequency of covid tests for the citizen to prevent delaying treatments that potentially lead to death. With a lot of events such as concerts and sports games, it would be great to implement mask mandates and requirements of vaccinations certificate to attending such events
WHO could collaborate with the officials of African countries to broaden the vaccinations scale throughout Africa and educate the citizen especially for the countries such as Eritrea, Burundi, Cameroon, Madagascar, and Republic of Congo with low vaccinations rate (<10%)


Comments