Disaster Dashboard of West Java
- Anang Hendro
- Nov 17, 2022
- 1 min read

Updated: Jan 24, 2023
Tools : Spreadsheet, Tableau, Figma
In order to participate in the Jabar Digital Service Data Visualization Competition, this project was developed. All data were gathered from Open Data Jabar, which offers a variety of datasets covering all phenomenon in the province of West Java.
Background Information
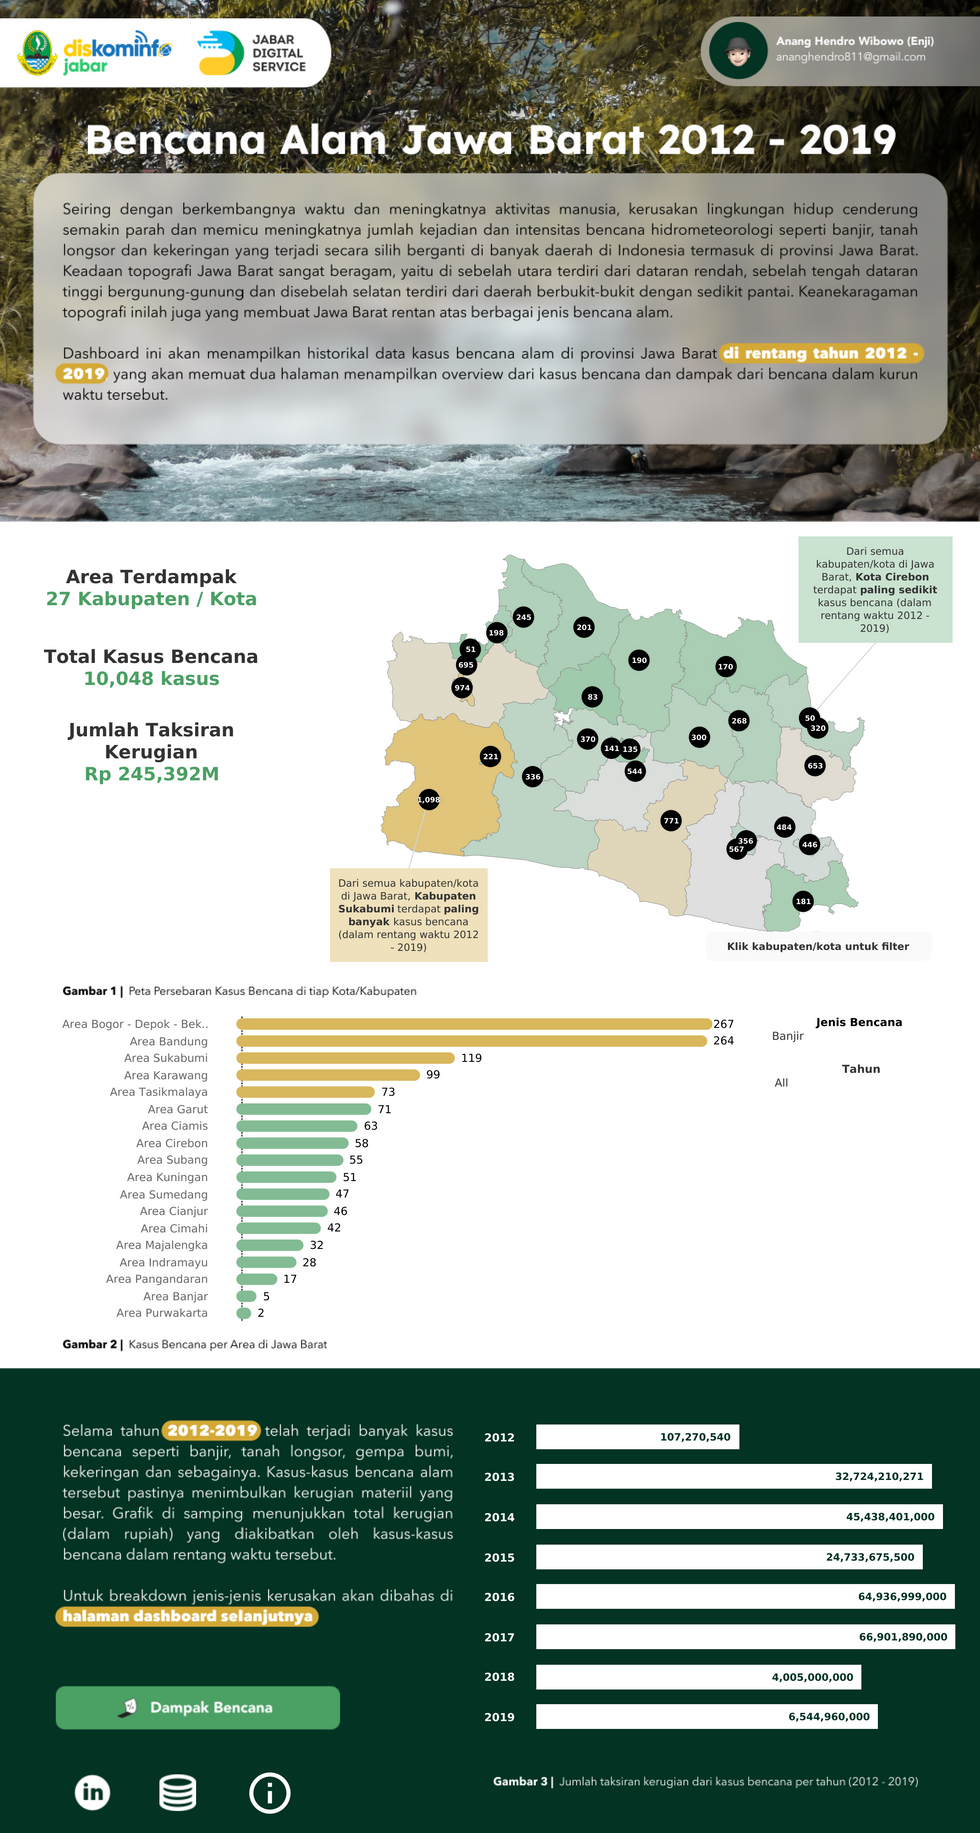
As time progresses and human activities increase, environmental damage tends to get worse and triggers an increase in the number and intensity of hydrometeorological disasters such as floods, landslides and droughts which occur one after another in many areas in Indonesia, including in the province of West Java. West Java's landscape is extremely varied, with lowlands in the north, rugged highlands in the middle, and hilly regions with a few beaches in the south. West Java is more susceptible to numerous forms of natural disasters due to its diverse topography.
This dashboard will present historical information about natural disaster cases in the West Java province for the years 2012 to 2019, and it will include two pages with a summary of those instances and their effects throughout that time.
Objective
Create an interactive dashboard with data on historical disasters in West Java including victims, financial losses, and property damage for the years 2012 to 2019
Analysis Method
Combine several datasets into single Excel files. Asking some key points that could be answered by creating charts and graphs in Tableau
Which city or district experienced the most cases of disasters between 2012 and 2019?
How’s the distribution of each disaster instance occurred in each city and region between 2012 and 2019?
How much was the loss due to disasters between 2012 and 2019?
How many people were affected as a result of disasters between 2012 and 2019?
How is the distribution of disaster-related damage to houses and facilities?
Insights
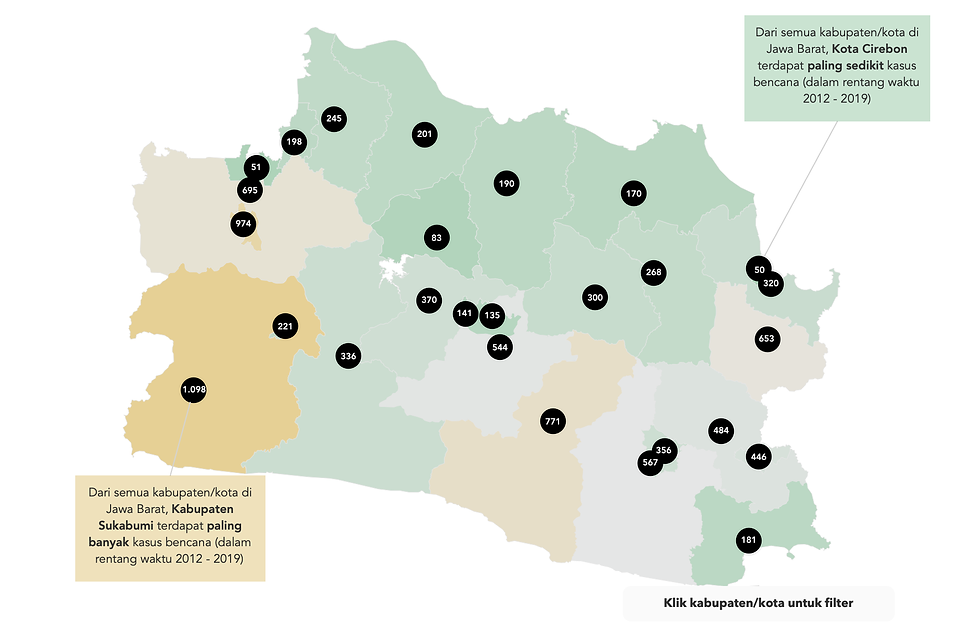
West Java experienced 10,048 cases of disasters between 2012 and 2019. Sukabumi district has the most disaster cases (1098 cases) and Cirebon city has the fewest cases (50 cases)
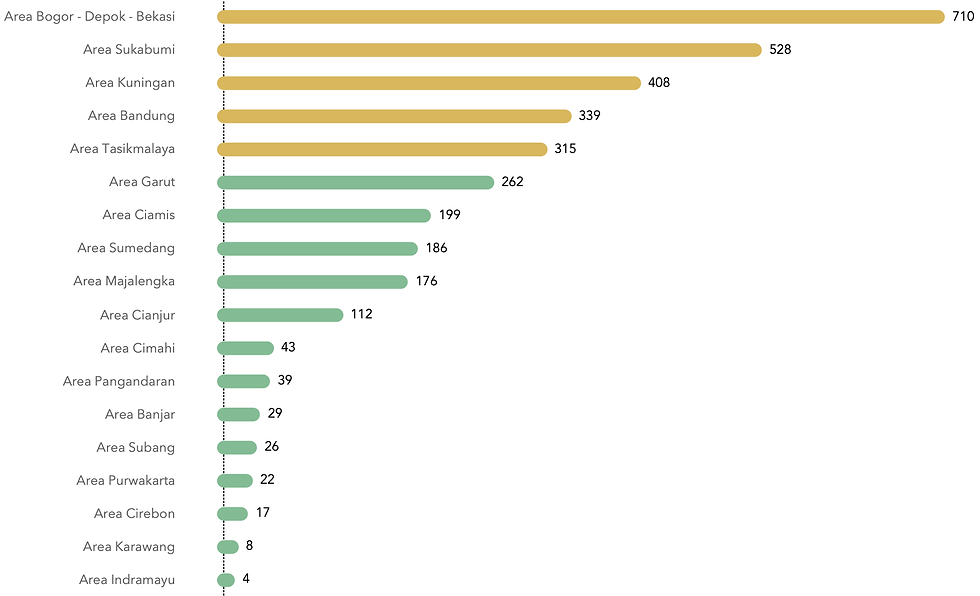
Disasters cases include a variety of disasters such as floods, tidal waves, earthquakes, fires, landslides, and tornadoes. From 2012 to 2019, the Bogor-Depok-Bekasi and Sukabumi areas had the most cases of disasters. Landslide and fire being the most frequent cases of disasters
There are 267 flood cases in Bogor-Depok-Bekasi area
There are 3 tidal waves cases in Sukabumi area
There are 155 earthquake cases in Sukabumi area
There are 692 fire cases in Bogor-Depok-Bekasi area
There are 473 tornado cases in Bogor-Depok-Bekasi area
There are 710 landslide cases in Bogor-Depok-Bekasi area
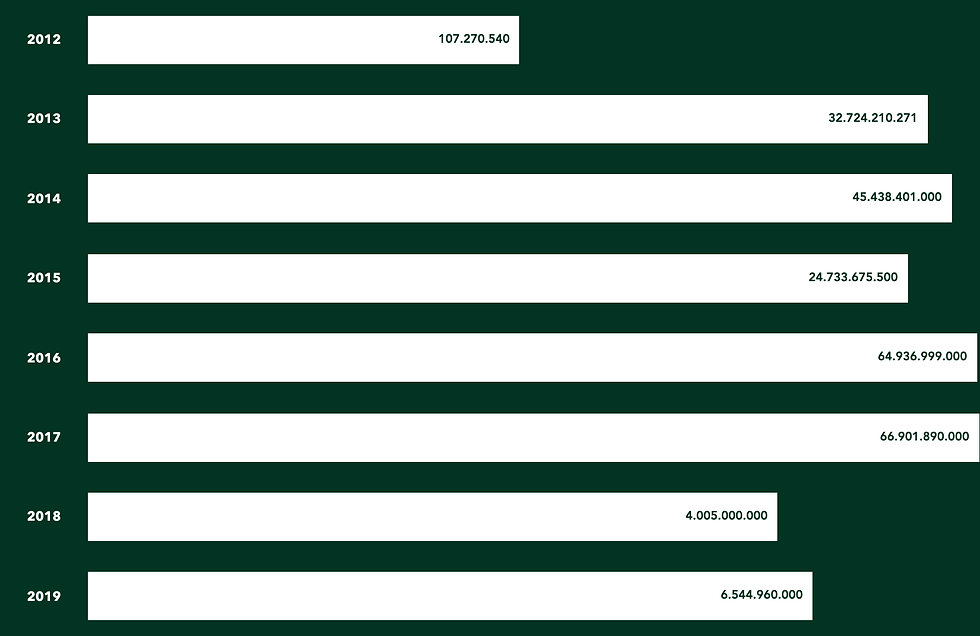
The total loss was 245.392 billion Rupiah, with the highest loss in 2017 being 66.902 billion Rupiah. In more detail, there is a significant increase in loss from 2015 forward.
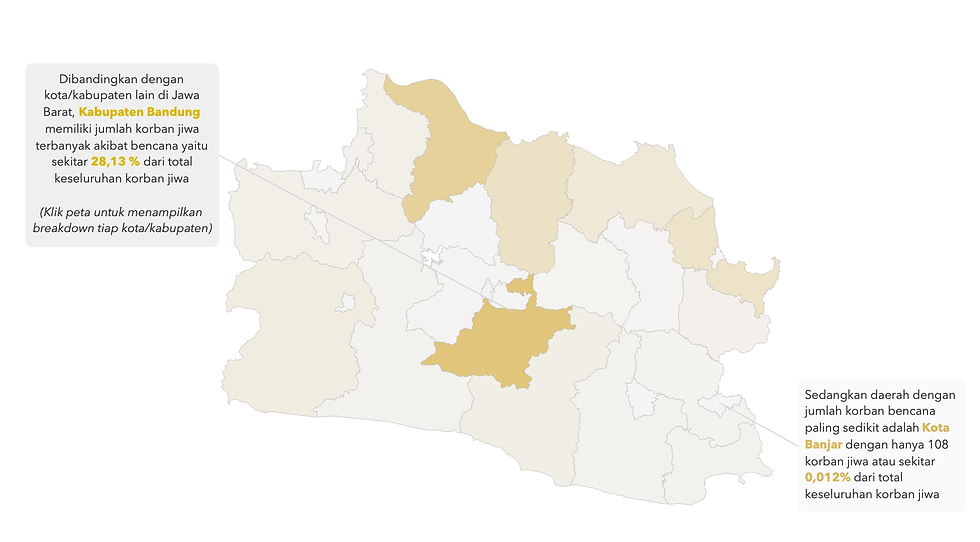
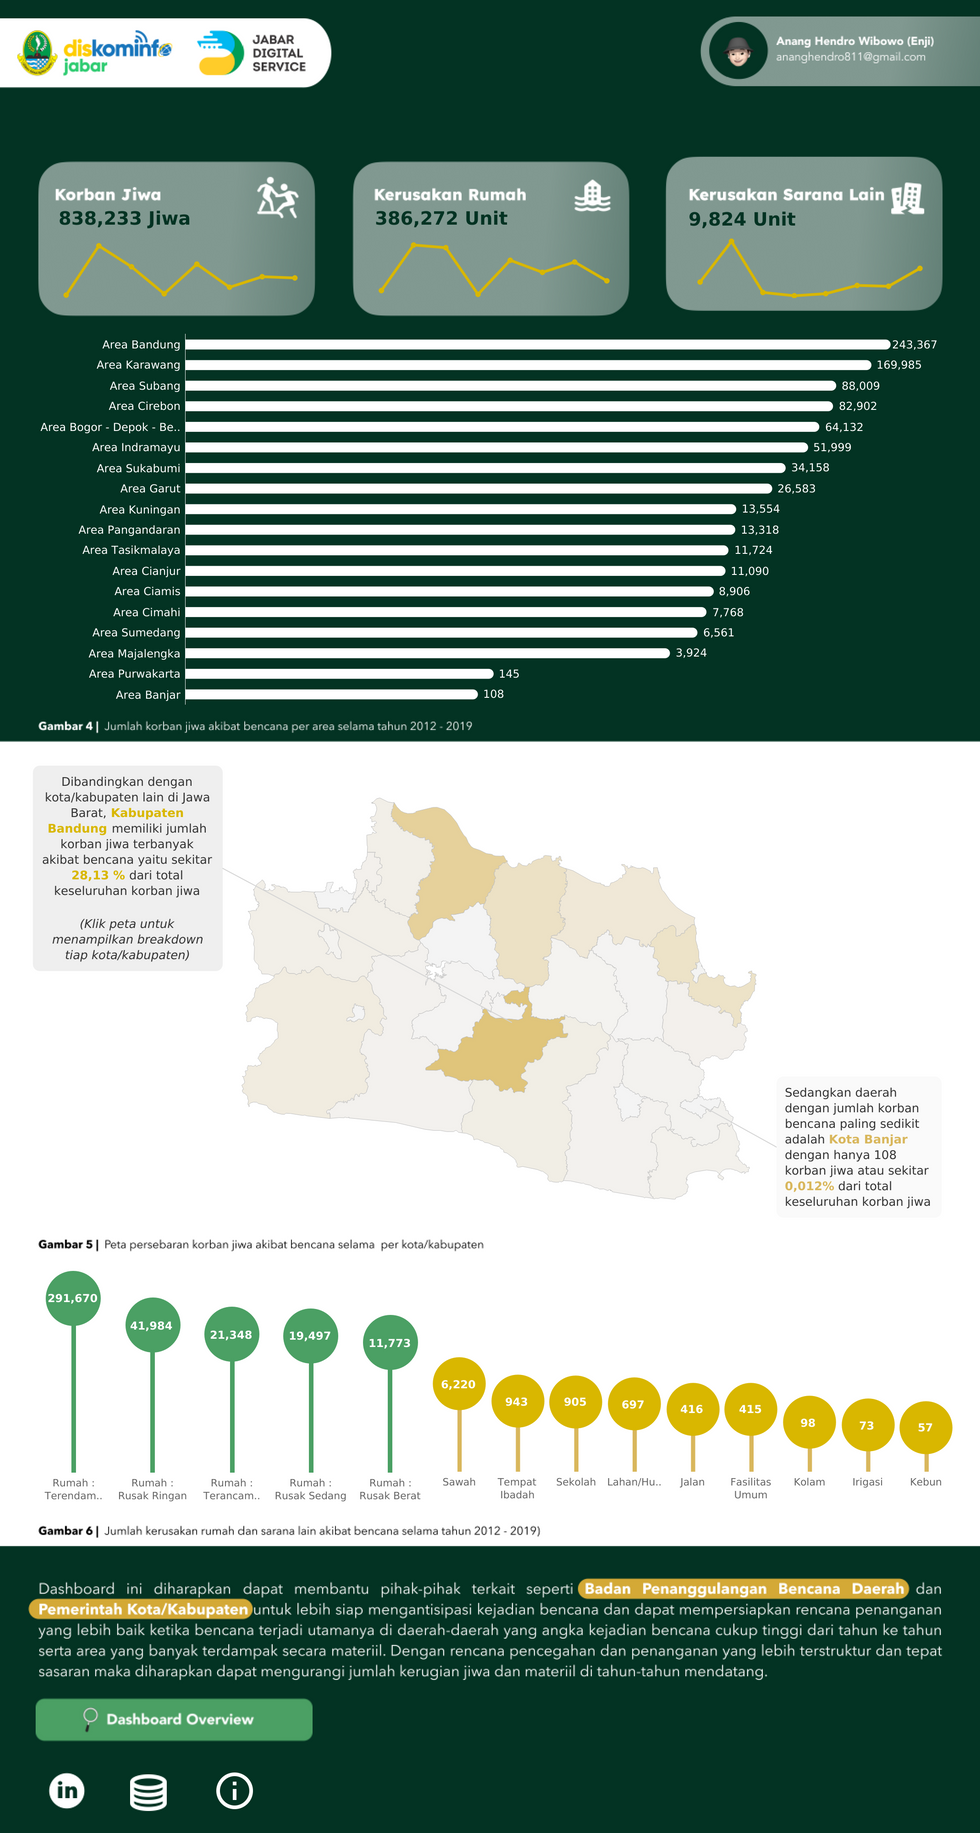
The total number of people affected by disasters is 838,233 people. With 243,367 victims, the Bandung district has the highest number of victims.
The total number of damaged houses is 386,272 units with 291,670 units submerged by floods
There are 9824 damaged facilities in total, with 6220 of them being rice fields.


Comments