SQL Individual Assignment: San Fransisco Bikeshare and HackerNews
- Anang Hendro
- Dec 28, 2022
- 1 min read

Updated: Jan 24, 2023
Tools : Google Big Query, Tableau

This project was part of RevoU's individual assignments as a practice of retrieving and analyzing data using Google Big Query to answer some of the business problems.
Background Information
For this project, I use two different datasets:
San Francisco Ford GoBike, managed by Motivate, provides the Bay Area’s bike share system. Bike share is a convenient, healthy, affordable, and fun form of transportation. It involves a fleet of specially designed bikes that are locked into a network of docking stations. Bikes can be unlocked from one station and returned to any other station in the system. People use bike share to commute to work or school, run errands, get to appointments, and more. The dataset contains trip data from 2013-2018, including start time, end time, start station, end station, and latitude/longitude for each station.
2. Hacker News.
This dataset contains all stories and comments from Hacker News from its launch in 2006 to the present. Each story contains a story ID, the author that made the post, when it was written, and the number of points the story received.
Objective
Creating SQL queries based on business problems using aggregate functions, date format, joins, CTE, and window functions.
Creating monthly retention cohort to help retain users.
Analysis Method
Using various syntaxes, I try to retrieve data from the database and conduct Exploratory Data Analysis and answer some related business questions
Insights
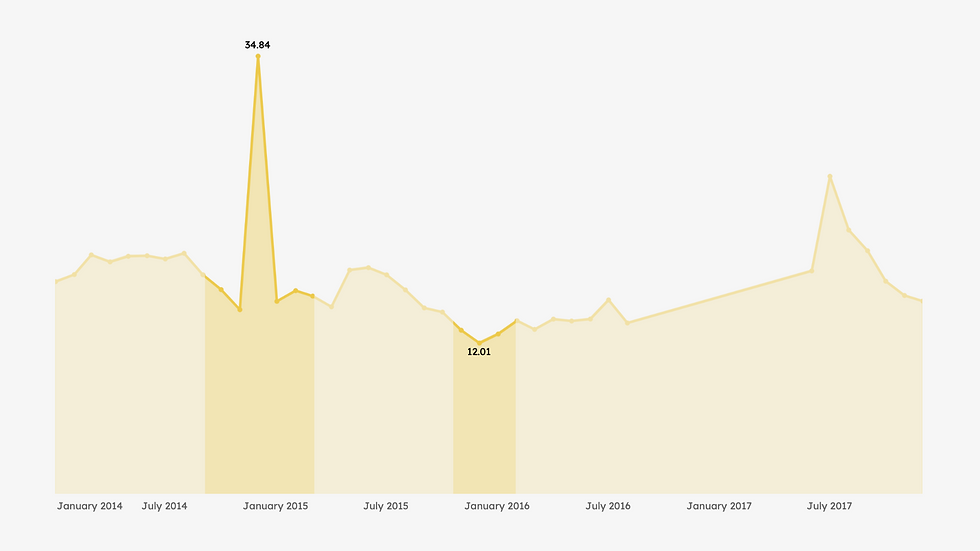
The highest number of average trips (in minutes) was shown in December 2014 (~34 minutes) with the least minutes of trips shown in December 2015 (~12 minutes). However, the average minutes of trips have been increasing ever since
San Fransisco is the region with the highest number of trips from 2014 to 2017 which contributes around 90% of total trips in the dataset. Emeryville, on the other hand, has the lowest number of trips with only 3566 trips (0.3%)
San Fransisco currently also has the highest number of bikes (34.8% of the total bikes provided)
San Jose currently has the lowest number of bikes with only 771 bikes (9.6%)

After retrieving the data from November and December 2017. We came across some findings. The total trips in December generally decline compared with the total trips in November with only Berkeley having a slight increment compared to the previous month

We find that from September 2016 until May 2017, we got a missing value of trips. It could be an error in the data input process/record, so we should confirm with the related team first (data engineer or database PIC) before doing further analysis.
Based on the chart made with the available data, the number of trips shows an increment each year except in 2016.
The low number of trips in 2016 could be contributed to the missing data values
The highest number of trips occurred in 2017 with 368,708 trips, even with a couple of months of missing data. So we expect the total number could be even bigger

COHORT ANALYSIS
From cohort analysis using Hacker News dataset, it was shown that over the year, monthly retention generally declined. As shown in month 1, it even jumps down to 15,86% from the initial month (churn rate ~85%)
The retention rate constantly shows decrement reaching 2,55% in month 21
The monthly retentions across the tables show a low retention rate with the value not even reaching 20% every month

Comments